The Journal of Credibility Assessment  and Witness Psychology
2002, Vol. 3, No. 1, pp. 1-22
Published by the Department of Psychology of
Boise State University
P300
Scalp Distribution as an Index of Deception: Control for Task Demand
J. Peter Rosenfeld, Archana Rao, Matthew
Soskins,
& Antoinette Reinhart Miller
Northwestern University, Department of
Psychology
Correspondence regarding this article should be addressed to Dr. J. Peter Rosenfeld, Department of Psychology and Institute for Neuroscience, Northwestern University, 2029 Sheridan Rd., Evanston, IL 60208. EMAIL: jp-rosenfeld@northwestern.edu
Copyright 2002 by the Department of Psychology of Boise State University and the Authors. Permission for non-profit electronic dissemination of this article is granted. Reproduction in hardcopy/print format for educational purposes or by non-profit organizations such as libraries and schools is permitted. For all other uses of this article, prior advance written permission is required. Send inquiries by hardcopy to: Charles R. Honts, Ph. D., Editor, The Journal of Credibility Assessment and Witness Psychology, Department of Psychology, Boise State University, 1910 University Drive, Boise, Idaho 83725, USA.
ABSTRACT: Participants (n=24) experienced a
baseline Block 1: they saw their phone numbers presented in a series with 6
other phone numbers. They were to
say “yes” to their phone numbers, “no” to others. They were asked to repeat the first 3 digits of the phone
numbers aloud. In Block 2, LIE and
CONTROL groups (both n=12) were formed: participants saw a series of dates
(e.g., “Mar 9”), 14% of which were their birth dates. The LIE participants were asked to lie on 50% of the trials,
and to repeat all stimuli aloud.
The CONTROLs were to perform honestly in Block 2, and were asked to
repeat all stimuli aloud, but a random half of the stimuli backwards. The aim was to equalize task demand
between groups. The results were
that for both scaled and unscaled P300 amplitude, there were no differences or
interactions as a function of group, or block in comparisons of responses to
honest, forwards-repeated stimuli (p>.6). For pooled Block 1-Block 2 honest responses vs Block 2 dishonest
responses in the LIE group, there was a main effect of response type on
unscaled amplitude (lie responses<true responses, p<.03). Conversely, there was no main effect in
the CONTROL group of the forwards/backwards manipulation (p>.15). In scaled amplitudes, there were no
interactions of group or response type with site (p>.2) in honest, forwards
responses. Comparing all scaled
LIE honest with dishonest responses in the LIE group yielded a significant
interaction of response type x site, p<.02. Post-hoc ANOVAs, using just Cz and Pz showed a significant
interaction in the LIE but not CONTROL participants. There were no P300 latency differences between groups or
conditions. In an extended
replication, reaction time data did not differ between LIE and CONTROL groups.
The results continue to support the notion that a P300 profile, specific for
deception, may be identifiable.
P300 Scalp Distribution as an Index of
Deception: Control for Task Demand
Introduction
We
have previously reported that in various situations, the scaled scalp
distribution (profile) of P300 amplitude differs from deceptive to
truth-telling conditions, (Rosenfeld, Reinhart, Bhatt, Ellwanger, Gora, Sekera,
& Sweet, 1998; Rosenfeld & Ellwanger, (1999), Rosenfeld, Ellwanger,
Nolan, Wu, Berman, & Sweet, 1999).
Johnson (1988, 1993) has argued that when the ERP profile differs from
one condition to another, this is good evidence that the two conditions involve
differing neurogenerator groups.
Although
one may take advantage of differential profiles for truth-tellers and liars in
practical detection of deception applications, one cannot argue from such data
that the liar’s profile specifically represents deception. In the paradigms previously used
(Rosenfeld & Ellwanger, (1999); Rosenfeld et al, (1999); Rosenfeld et al.,
1998), the task demands on the liar were greater than those on the
truth-teller: The latter simply
had to tell the truth whereas the liar had to maintain an instructed,
random-appearing, 50% (approximately) deceptive error rate, and thus also had
to decide on each trial whether or not to lie. The observed differences in profile between the two groups
could have represented differences in task demand as well as differences in
honesty.
In
the present study, we tried to construct an honest control group having task demands
comparable to those of the liar group.
Specifically, we used an autobiographical oddball paradigm in which
participants saw a Bernoulli (randomized) series of seven, repeatedly presented
dates, 14.3 percent of which were their own birth dates. In the Lie group, participants were
told to respond dishonestly on a random half of the trials (of both oddball and
frequent type), and to then repeat the stimuli aloud. (Only the first three letters of the month were
repeated.) In the Control group,
participants were told to respond aloud honestly on all trials, but to then
repeat a random half of the stimuli aloud backwards, (the rest, forwards). Both groups had comparable task demands
in the terms noted above, but one group responded honestly and the other
dishonestly. Differing P300
profiles would not be simply attributable to differences in task demands.
In
this study, there is a second set of evidence examined which bears even more
directly on putative specificity of Lie profiles: On the block of trials where
the Lie participants respond dishonestly on half the trials, there is the
opportunity to compare the P300 profiles associated with honest and dishonest
response trials. Since task
demands are the same during the entire block within the Lie group, obtained
profile differences would provide support for the specificity hypothesis. We looked for but failed to find such
an effect earlier (Rosenfeld et al., 1999) using a different (match-to-sample)
paradigm.
We
note that Johnson’s (1988, 1993) interpretation of the meaning of differing
scalp profiles emphasizes the possibility of differing neurogenerator
sets. There is another
interpretation of the differing scalp profiles in two experimental conditions:
It may be that the two conditions evoke different sets of components which
differentially overlap the P300 which both conditions evoke in common (Donchin,
Spencer, & Dien, 1997). Either
interpretation implies that the brain works in a specific way during deception,
and the evidence would become the first to support a specific lie response,
said to be a “dream” by Lykken (1981).
Such a finding would also be a step in the direction of elucidating
brain systems involved in lying.
Why
might one expect differing scalp distributions in Lie and Control groups if
task demand is matched? We
hypothesize that a participant who is lying, even though he/she was directed to
do so, has some level of self-awareness on all deceptive trials; that he/she is
engaging in a behavior on which society and authority figures frown. At least some participants may thus
find themselves somewhat embarrassed at being observed during lies. More important, all Lie participants
(and no Control participants) know they are lying as they lie, and probably
engage in further lie-specific cognitions following the decision to lie as well
as following the act of lying.
These cognitions would pertain to knowledge of the mismatch between the
true-correct answer versus the answer they produce on a lie trial. We hypothesize that the Lie condition,
but not the Control condition, will generate brain activity related (at least)
to both the additional cognitions following such mismatch experiences, as well
as to self awareness of deception, and that P300 profiles may reflect these
differences between Lie and Control conditions.
Differences
between Lie and Control groups might also be expected on the basis of the
latter’s additional task: backwards repetition of stimuli. A comparison restricted to profiles of
Lie and Control groups during their respective specific tasks could thus be
confounded by the two task effects simultaneously operating: 1) honest vs. dishonest responding and
2) backwards vs. forwards repetition.
We therefore ran both groups through two blocks of trials, one (Block 1)
in which all participants behaved alike in responding honestly and repeating
stimuli forwards, and a second block (Block 2) in which the Lie participants
lied on half the trials with forwards repetition, and the Control participants
responded honestly on all trials but repeated half the stimuli in a backwards
manner. Thus in each group, we
could compare departures in Block 2 from the benchmark/baseline condition of
Block 1.
Method
Participants: The 24 participants (12 per group, 13
female, six of which were in the Lie group) were recruited from the department
introductory psychology pool and were fulfilling a course requirement. All had normal or corrected vision.
Procedure: Following signing of consent form,
instruction, and electrode attachment, participants were seated in a recliner
such that a video display screen was in front of their eyes. The visual stimuli were presented on
this screen every 6.0 s, a relatively long interstimulus interval required for
verbal responding so as to allow the artifact associated with vocalization to
dissipate prior to the subsequent trial.
The trial began with the onset of pre-stimulus EEG baseline recording
for 104 ms. The stimulus then appeared on the screen and endured for the
remainder of the ERP recording epoch = 1944 ms (total epoch = 2048 ms).
Immediately after clearance of the stimulus from the screen, the message
"Please Respond" was presented and lasted 2 s. The participant was required to respond
during this time.
There
were two blocks of trials used in this study. In the first block (Block 1), the visual stimuli were
participants’ phone numbers (p = .14) and other phone numbers (p = .86), each repeated
as many times(about 40) as the subject’s phone number. Both Control and Lie
participants were told to respond aloud truthfully and ordinarily in this
preliminary block. The timing and
parametric settings in this benchmark/baseline block were the same as in the
actual test block (2) to be next detailed. In this second block (Block 2), the stimuli were the first
three letters of a month, followed by a number from 1 to 31, e.g., MAR 9. Thus,
birth dates could be formed. The participant then said "yes" or
"no" signifying birth date or other date, respectively, and then
immediately repeated aloud the three-letter symbol of the month.
In
the Control group, the participants were (in Block 2) instructed to respond
honestly "yes" or "no" and to then repeat these month
symbol letters aloud backwards on approximately half the trials of both types
(birth date, non-birth date). They
were also instructed to try giving a random, as opposed to patterned, series of
forward and backward responses. We
suggested to these participants that we were interested in how well people can
generate random sequences of responses while doing a foreground task. We also alerted them that if the
computer detected patterned responding, the experiment would be
re-started.
In
Block 2, the Lie group participants were instructed to simulate malingered
cognitive deficit as in Rosenfeld et al. (1998), by making dishonest
"errors" on both trial types about half the time in response to the
"Please Respond" message.
They were told to generate a random, unpatterned series of deceptive responses,
since the computer controlling the experiment could discern patterns, and that
they would not "beat the test" if patterned responding was discerned,
and the experiment would be re-started.
Immediately after their "yes" or "no" response, they
were required to repeat the first three letters of the month (in the normal,
forwards order). Both groups were
told there would be 45 presentations of birth dates randomly interspersed among
276 presentations of other dates; i.e., six dates each repeated 45 times. This was done in order to help them
score close to the 50% target rate of deceptive or backwards responses. Following the response window (2.0 s)
was a second 2.0 s period of no events prior to the start of the next trial.
(Verbatim instructions are available on request from the senior author.) Table 1 presents stimulus-response
combinations for both groups and both blocks, with abbreviations.
EEG
recording and analysis: EEG was
recorded with Grass P511k preamplifiers with gain = 100,000, and filters set to
pass signals between 0.1 and 30 Hz (3db points). Electrodes (Ag - AgC1) were
attached to Fz,Cz, and Pz referenced to linked mastoids with the forehead
grounded. Impedances were
maintained below 5000 ohms. EOG
was recorded from a bipolar pair of electrodes above and below the eye. EOG signals > 80 uV led to trial
rejection and replacement.
Amplified signals were led to 12-bit A/D converters (Keithley-Metrabyte)
sampling at 125 Hz, and the digitized signals led to a computer for on-line
sorting, averaging, and storage.
The computer programs (by the senior author) also controlled stimulus
presentation, and performed off-line filtering and analyses.
In
the present study, P300 determination is based on a standard baseline-to-peak
method: The computer searches
within each participant's average ERP within stimulus, paradigm and response
categories (see Table 1), within a window which extends from 400 to 1000 ms
post-stimulus for the 104 ms segment average (13 data points) which is most
positive-going. From this segment
average, the average of the first, pre-stimulus, 104 ms of the recording epoch
is then subtracted. The difference
defines unscaled P300 amplitude.
![Text Box: Table 1: Abbreviation Summary of stimulus-response combinations:
(a.) LIE Group
Test Block 1 (all forward honest responses)
OD1[L]: oddball stimulus, honest response
FR1[L]: frequent stimulus, honest response
Test Block 2 (all forward responses)
OD2-TRU: oddball stimulus, honest response
OD2-LIE: oddball stimulus, dishonest response
FR2-TRU: frequent stimulus, honest response
FR2-LIE: frequent stimulus, dishonest response
(b.) CONTROL Group
Test Block 1 (all forward honest responses)
OD1[C] oddball stimulus, forward response
FR1[C] frequent stimulus, forward response
Test Block 2 (all honest responses)
OD2-FOW: oddball stimulus, forward response
OD2-BAC: oddball stimulus, backward response
FR2-FOW frequent stimulus, forward response
FR2-BAC frequent stimulus, backward response](200201_files/image001.gif)
The midpoint of
the maximally positive segment defines P300 latency. This is a typical method of measuring P300 (Fabiani,
Gratton, Karis, & Donchin, 1987).
The
method just described is done only with Pz recordings. For the Cz and Fz sites, the temporal
boundaries of the maximally positive segment at Pz are used to define the
window over which P300 amplitude is calculated. This procedure is utilized to be certain that the same
neural process is sampled across sites for purposes of profile
construction. It is typically used
by researchers who focus on scaled P300 amplitude profiles (e.g. Ruchkin,
Johnson, Grafman, Canoune, & Ritter, 1992).
For
group analyses, P300 latency and amplitude were based on unfiltered averages
for each participant. For display,
averages were digitally filtered to pass low frequencies; 3db point: 4.23 Hz. For task-by-site interactions, average
P300 amplitudes within each participant were filtered and then scaled using the
vector length method (McCarthy & Wood, 1985): Within each group and/or
stimulus/response condition, the average Fz, Cz, and Pz values for the
condition/group were squared, and the square root of the sum of the squared
values was used as a denominator by which individual Fz, Cz, or Pz values
within the condition/group were divided.
It
is noted that analyses are performed here on both scaled and unscaled
data. To look at main effects of
group, stimulus type, block, response type, and scalp site on amplitude, it is
appropriate to look at unscaled data (McCarthy & Wood, 1985). However, to answer questions involving
interactions with site, (the major questions here) McCarthy & Wood (1985)
explained the need for analysis on scaled data. What the scaling accomplishes is the removal of possible
amplitude differences between conditions, which may confound amplitude
distribution differences. The
scaling procedure in the present study removes main effects of group, paradigm,
response type, and stimulus type, and allows meaningful interpretation only of
interactions involving site. Thus,
as recommended by McCarthy & Wood (1985), we report analyses on both scaled
and unscaled data, as appropriate. (Latency need not be scaled).
Extended
Replication: The above procedures were repeated one
year later, with one modification, on two new groups of Lie and Control
subjects, (N=10, 11 respectively): Interspersed randomly among the oddball and
frequent trials were 20 probe trials.
On these trials, the word “Go” appeared on the computer screen and all
participants were instructed to press a response button as soon as possible
thereafter. This allowed us to
obtain reaction time (RT) data and compare RTs between Control and Lie
groups. Such information could
then support our contention of equalization of task demands between groups; (RT
is frequently used to assess task demand.) The probe trial stimuli appeared with the same timing as the
other stimuli. Although electrodes
were attached as in the original study and ERPs recorded, the ERP analysis
presented is based on the original experiment. The modified replication was analyzed here only for RT data.
Results
Note: The key
quantitative results on scaled data are in sections E and F below, and in
Figure 6. Other results are
reported immediately below in sections A, B, C, and D.
A.
Behavioral (original study):
The mean numbers of responses in each stimulus-response category (see
Table 1 for abbreviations) are shown in Table 2. There are six rows in each group and the numbers in the
first row in the Lie group should correspond to those in the first row in the
Control group, the second row in the Lie group with the second row in the
Control group, and so on. The appropriate correspondences are close except for
the fifth (second to the last) row, involving frequent stimuli (Lie = 101.58
vs. Control = 87.75). For the first four rows involving the oddball responses
in both groups in both blocks, and the frequents of Block 1, there were no
significant differences.
|
Table
2: Average numbers (+
SEM) of responses in each possible stimulus-response category. Table 1 and text define category
abbreviations. |
||
|
Row Lie
Group |
Category |
Number |
|
1 |
OD1[L] |
24.67
+/- .97 |
|
2 |
FR1[L] |
146.58
+/- 5.80 |
|
3 |
OD2-TRU |
17.25
+/- .85 |
|
4 |
OD2-LIE |
15.00
+/- .90 |
|
5 |
FR2-LIE |
101.58
+/- 4.46 |
|
6 |
FR2-TRU |
86.50
+/- 4.24 |
|
Control
Group |
|
|
|
1 |
OD1[C] |
25.67
+/- .99 |
|
2 |
FR1[C] |
143.67
+/- 7.16 |
|
3 |
OD2-FOW |
15.17
+/- .91 |
|
4 |
OD2-BAC |
14.83
+/- 1.28 |
|
5 |
FR2-BAC |
87.75
+/- 6.54 |
|
6 |
FR2-FOW |
87.80
+/- 5.26 |
There were
significant effects regarding the last two rows containing frequent stimulus
data, however these will not be detailed since all ERP analysis will focus only
on oddball trials; P300s in many participants on frequent trials in both groups
were dubious. The present
behavioral data indicate comparability between groups for oddball
stimulus-response combinations; (the differences found for frequents were small
though significant).
B. RT data
(modified replication): Average RTs
to probe stimuli within each subject were averaged to yield separate group
means, for each of the two blocks.
For the first block in which all subjects performed in the same manner,
the mean RT (+/- SD) for the Control group was 1.109S (+ .3984) and for the Lie
group was 1.305S (+ .2098). On
this difference, t(19)
= 1.425, p
= .17 (ns). In the critical second
block, the differences were similar: Control = 1.02 S (+ .3925), Lie = 1.221S
(+ .1927); t(19)
= 1.47, p
= .16 (ns). These negative data suggest
that the two tasks did not impose differential demands on the two groups of
subjects.
C. ERP data: Qualitative observations in
grand average ERPs: In the first block, there should be no
ERP differences between groups in response to either oddball or frequent
stimuli, since both Lie and Control groups are behaving exactly alike in this
block (see Table 1 and methods). Differences between groups in amplitude and
latency of P300 did not, in fact, reach significance (see below).
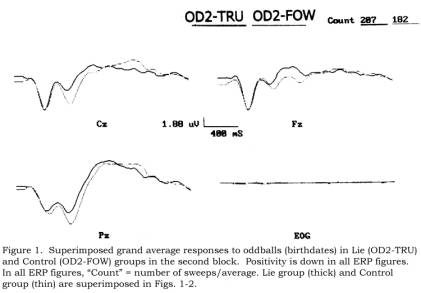
For
quality control purposes, Figure 1 shows superimposed Lie and Control grand
averages for OD2-TRU and OD2-FOW trials (all honest, forwards responses in
block 2). It appears that the P300 is reduced in the Lie group relative to the
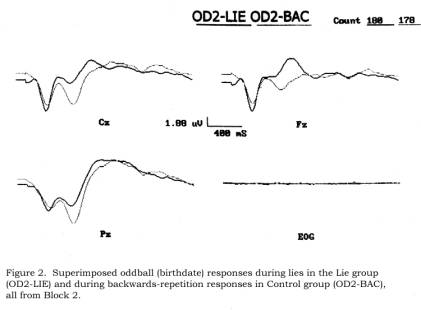
Control group. Figure 2 shows
superimposed Lie and Control grand averages for OD2-LIE (dishonest, forwards)
and OD2-BAC (honest, backwards) trials, and again, the P300s appear larger in
the Control group.
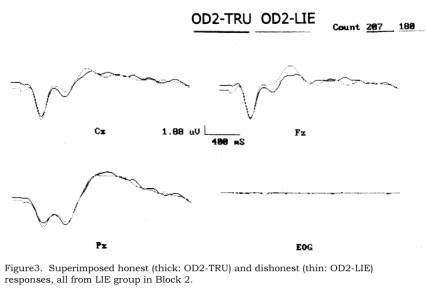
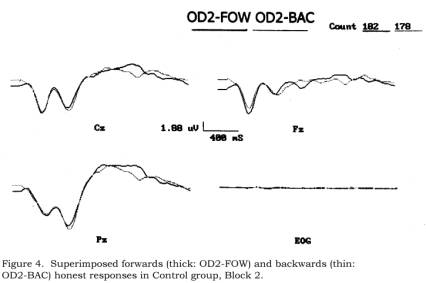
Figure
3 shows superimposed OD2-TRU (honest) and OD2-LIE (dishonest) responses within
the Lie group. The former set appears to have more positive P300 responses,
especially at Fz and Cz. (The
differences would be more obvious if we chose, in the figures, to superimpose
pre-stimulus baselines, which our P300 calculation algorithm does do. We present
data in figures as they really are, i.e., with random-noise related baseline
shifts.) In Figure 4, comparable superimpositions are shown within the Control
group: OD2-FOW (forwards) vs. OD2-BAC (backwards). In this comparison, P300 in
the latter category appears slightly more positive (which, again, would be more
evident with aligned baselines).
D. P300
amplitude data analysis: Unscaled data:
We restrict reporting of results to oddball trials, since it was
frequently impossible to locate a clear P300 peak in the frequent averages
within participants.
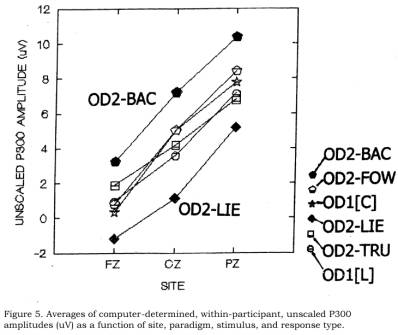
Figure
5 shows the group average, computer-determined P300 amplitude values as
functions of site, group, block (1 vs 2), and stimulus-response combination. It
appears that within the Lie group, there is little difference in amplitude or
slope, between OD1-[L] and OD2-TRU amplitudes (both associated with honest
responses), but that lying (OD2-LIE) produces a depression of amplitudes. In
the Control group, the OD1[C] and OD2-FOW response curves are also aligned, and
indeed do not appear to differ from comparable Lie group honest response curves
just described. This is as predicted. However, in the Control group, the
OD2-BAC amplitudes appear enhanced by the backward condition manipulation.
To obtain statistical
confirmation of these effects, we first examined possible group and block
differences during honest, forwards responses OD1[L], OD2-TRU, OD1[C],
OD2-FOW. The sets of P300
amplitudes classified in this way were submitted to a 3-way ANOVA, with
independent variables group (Lie vs. Control), site, and Block (1 vs. 2 for
both groups).
The
effect of group was not significant (p >.7). Neither was the effect of
Block (p
>.6). The effect of site yielded F(2,44) = 134.34, pg < .001 (pg is the Greenhouse-Geiser
corrected probability in within-subject tests with df > 1. The correction is
for sphericity effects. For df = 1 tests, the usual p-values will be
reported.) The interactions were not significant, (p >.2), excepting
the group-by-site interaction, which yielded F(2,44) = 4.18, pg < .04, reflecting
the somewhat steeper slopes for honest, forwards Control curves than for the
honest, forwards Lie curves in Figure 5. (As noted in the methods, without
scaling or normalization of amplitudes, all interaction effects or lack of
interactions, are possibly confounded and not simply interpretable).
To
get at the effects of primary interest here, we compared each of the Block 2
special response types with their respective pooled
truth-telling/forwards-repeating values. (Since the 3-way ANOVA described above
showed no differences between groups or block during truth-telling and
forwards-repeating trials, the pooling was legitimate.) Thus we averaged OD1[L]
and OD2-TRU to form OD-TRU, and we averaged the comparable Control data to form
OD-FOW.
Within
the Lie group, we then compared OD-TRU (honest) and OD2-LIE (dishonest) and
examined site effects. The effect of site was F(2,22) = 89.98, pg < .001. The effect
of honest vs. dishonest responses was F(1,11) = 7.11, p < .03, reflecting
the lower value of averaged OD2-LIE responses in comparison with averaged
OD-TRU (the pooled average of OD1[L] and OD2-TRU). The interaction of site and
response type was not significant (p > .4). In the Control group, the effect of site was F(2,22) = 73.36, pg < .001. There was
no significant effect of forwards versus backwards repetition (p > .2), despite the
appearance of such a difference in Figure 5. Neither was the interaction of
response type and site (p > .6) significant. Thus, although the
dishonest response manipulation had a significant effect on unscaled P300
amplitudes in comparison with honest responses, the backwards repetition
manipulation did not.
E. P300
Amplitude analysis; scaled data: group comparisons: In
this section, we will comment only on interaction effects, since the scaling of
data intentionally obviates main effects other than site effects, which are
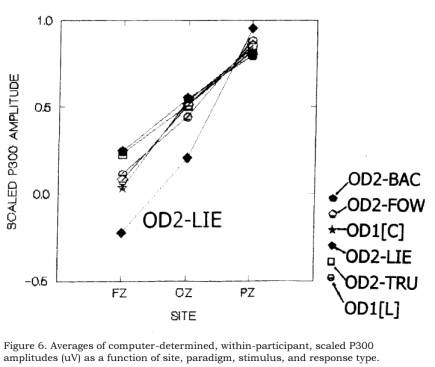
exaggerated (McCarthy & Wood, 1985). Figure 6 is the scaled equivalent of
Figure 5, and shows scaled P300 amplitudes as a function of site, block, group,
and response type. The figure suggests that all curves are similar except for
the curve of the Lie group, during the second block, and only on dishonest
response trials (OD2-LIE). We imply no interpretation of these scaled data
which we simply here display (Figure 6) and describe (Ruchkin, Johnson, &
Friedman, 1999).
Our statistical
analysis approach with scaled data parallels the approach used with unscaled
data. Thus the first analysis performed on scaled data was a 3-way ANOVA on all
honest-responding, forward-repetition conditions, i.e., with independent
variables: site, group, and block. The four response types separately submitted
by group were OD1[L], OD2-TRU, OD1[C], and OD2-FOW. No interactions were expected,
and none were found; (all p > .2).
Next,
as with unscaled data, we combined the honest, forward response trials within
each group to use as a benchmark-baseline with which to compare dishonest (Lie)
or backwards (Control) responses. Thus, OD-TRU is the average of OD1[L] and
OD2-TRU in the Lie group; OD-FOW is the comparable average within the Control
group. Within the Lie group, a 2-way ANOVA on effect of response-type (OD-TRU
vs. OD2-LIE) and site yielded a significant interaction of response type-by-site;
F(2,22)
= 6.76, pg
< .02. Within the Control group, the comparable ANOVA on effect of OD-FOW
vs. OD2-BAC with site also yielded a significant interaction; F(2,22) = 10.6, pg < .001. This was
in contrast to what is suggested in Figure 6, where the scaled curves seem all
alike (especially at Cz and Pz) except for the OD2-LIE (dishonest response)
curve. It is noted (Figure 6), however, that whereas in the Lie group, the
interaction shows (at Fz and Cz) a depression of OD2-LIE in comparison with
OD2-TRU (honest vs. dishonest responses), in the control group, the OD2-BAC
responses are (at Fz) slightly (though significantly) enhanced in comparison
with the OD2-FOW curve. (These
observations, again, imply no interpretation regarding relative activities or
source strengths at the noted sites, but are meant simply to illustrate
different kinds of interactions in Lie and Control groups; Ruchkin et al.,
1999.)
We
performed comparable ANOVAs, post-hoc, on data from just the Cz and Pz sites.
In the Lie group, OD-TRU vs. OD2-LIE interacted with site, F(1,11) = 24.32, p < .001. However,
in the Control group, OD-FOW vs. OD2-BAC did not interact with site (p > .15); neither
did OD1-FOW vs. OD2-BAC (p > .1).
F. P300
Scaled Amplitude Analysis: Within Lie Group: The major comparison in this study is
of the honest and dishonest response trials in Block 2 within the Lie group
(OD2-TRU vs. OD2-LIE). This is
because the task demands in the Lie group should be constant over trials within
the block. A 2-way ANOVA on
response type (honest/dishonest) and site did yield an interaction: F(2,22) = 7.2, pg < .02, as is
evident also in Figure 6.
G. Latency
Effects: Table 3 shows the Pz
latencies of P300 for oddball responses in the two groups, segregated by response
type. The Control group latencies are slightly greater than those of the Lie
group (although the largest difference in row 1 of the table occurs prior to
the group-generating manipulation). For both groups responding honestly and
with forwards repetition in both paradigms, a 2-way ANOVA was performed on
oddball latencies, with independent variables group and response type. There
were no significant effects for group (p > .2), response type (p > .5) or
interaction (p > .4).
Another 2-way
ANOVA was performed on Pz latencies involving group and honest, dishonest,
forwards, and backwards response types. Again there were no significant effects
of group (p
>.4), response type (p > .6), or interaction (p > .6). The present
manipulations had no effects on P300 latencies, suggesting that stimulus
processing task demands for the two groups did not differ, inasmuch as P300
latency has been associated with stimulus evaluation time (Fabiani et al.,
1987; Johnson, 1988).
|
Table 3: P300 Pz Latencies ± SD |
|||
|
Lie Group |
Control Group |
||
|
Response
Type |
Latency
(ms) |
Response
Type |
Latency
(ms) |
|
OD1[L] |
516 + 34.9 |
OD1[C] |
550 +/-
53.9 |
|
OD2-TRU |
518 + 80.2 |
OD2-FOW |
528 +/-
47.3 |
|
OD2-LIE |
518 + 49.6 |
OD2-BAC |
539 +/-
44.8 |
Discussion
We
have shown previously (Rosenfeld et al, 1998; Rosenfeld et al., 1999) that the
scaled scalp distributions (profiles) of P300 amplitude in deception conditions
differ from those seen in simple truth-telling conditions. Since the scaled scalp amplitude
distribution is independent of amplitude itself (McCarthy & Wood, 1985;
Johnson, 1988, 1993), it may well be the case that profile can become another
brain-wave-based channel (dependent measure) which could be used in practical
detection of deception situations.
There have now been several demonstrations that P300 amplitude, itself,
can be so utilized; (e.g., Rosenfeld, Cantwell, Nasman, Wojdac, Ivanov, &
Mazzeri, 1988, Rosenfeld, Angell, Johnson, & Qian, 1991, Ellwanger,
Rosenfeld, Sweet, & Bhat, 1996, Farwell & Donchin, 1991; Allen &
Iacono, 1992.)
One
could not say, however, on the basis of previous studies, that the profile seen
in deceptive conditions represented neural activity specific to deception,
itself, since, as reviewed in the introduction, deceptive and truth-telling
conditions previously utilized also differed in task demand: the truth-teller
had only to do his/her best on a simple task whereas the deceiver had to
(additionally) keep track of his/her deception rate, and decide on each trial
whether or not to lie.
The
present study was designed to address these considerations in 2 ways: (1)
allowing comparison of profiles between two groups (Lie and Control) in which
we attempted to equalize task demand to the maximum possible extent, and (2)
allowing comparison within the Lie group of profiles associated with honest
versus dishonest response trials.
Differing profiles in dishonest versus honest conditions would suggest
different neurogenerator sets associated with each condition (Johnson, 1993;
McCarthy & Wood, 1985). It may
also be that the two conditions evoke different sets of components which
differentially overlap the P300 which both conditions evoke in common (Donchin
et al, 1997). In either case,
however, the differing profiles indicate differing modes of brain function in
each condition.
In
fact, we found (Results, section F.) that scaled profiles differed in Lie group
members during honest versus dishonest response trials. Since the task demand on the Lie group
members was the same throughout the second paradigm task (i.e. during honest
and dishonest trials), it is suggested that the significant interaction of
response type (honest vs dishonest) by site provides evidence of differential
modes of brain operation during the two kinds of trials, and that this effect
is not confounded by task demand differences.
The
Control group, like the Lie group also had to make a decision on each trial
(whether or not to repeat a stimulus backwards), and had to track the same
ratio of the two kinds of available responses (50-50). When scaled amplitude data from all
three sites (Fz, Cz, Pz) were analyzed, this group also showed an interaction
of site and response type (honest forwards repetition vs honest backwards
repetition). However, the nature
of the change from the forward repetition condition in the Control group was
different than that seen in the Lie group. Indeed, if one considered only the Cz and Pz sites, then
only the Lie group showed an interaction effect in the response type
manipulation (response type x site) whereas the Control group showed no
(response type x site) significant interaction. Similarly, in unscaled data from all three sites,
significant main effects on amplitude were seen only in response to the honesty
manipulation and not in response to the forwards vs backwards repetition
manipulation. Thus the
honesty-dishonesty manipulation had greater effects than the forwards-backwards
manipulation (on unscaled Fz, Cz, Pz amplitudes, and on scaled profiles at Cz
and Pz) in this study.
Further
evidence that group differences are not attributable to stimulus complexity
aspects of task demand differences comes from the latency data: The P300 latencies did not differ
between Lie and Control groups.
Increases in task complexity involving greater stimulus processing
demand from one condition to another are usually reported to increase P300
latency (and to decrease amplitude; Johnson, 1988).
It
is also the case that in a modified replication of the present experiment in
which probe stimuli were randomly inserted in place of date and number stimuli,
there were no differences in reaction time to these probe stimuli between Lie
and Control groups. This was
further evidence of the comparability of task demand in these groups. We could not look at RTs to the other
stimuli (as is often customary) because of the delayed response requirement
necessitated by the need to avoid vocalization artifact. The probe stimuli, however, appeared in
exactly the same time slots as did the other stimuli. They were more rare and when presented, were probably
unexpected, as subjects most likely anticipated presentation of dates.
It
is not surprising that in scaled profile data, the Control and Lie groups had
differing profiles in Block 2 in comparison with their respective
benchmarks. The two tasks are
quite different in two ways, involving 1) honest (Control) versus dishonest
(Lie) responses, and 2) trials with forward (Lie) versus backward repetition
(Control). One could not say with
certainty that by themselves, these differing profiles are due to honesty
differences, repetition direction differences, or both. This is why we also used a first block
with all participants responding honestly with forward repetition of stimuli. Since these profile data did not differ
from the honest/forward repetition data in the second block, we pooled, within
each group, the honest/forward response data from both blocks and used them as
baseline/benchmarks with which to compare dishonest response profiles in the
Lie group and backwards response profiles in the Control group. The manipulations within each group
produced different scaled profile effects, in terms of shifts from the
benchmarks as noted above, and we would attribute the effect in the Lie group to
effects of deception.
This
is consistent with the finding of different profiles for honest and dishonest
responses within the second block of the Lie group, where within one block,
different profiles were obtained.
These effects might be attributable to deception specifically, since, as
noted above, these Lie participants were all treated alike and the only
difference between the cognitive states of Lie participants on trials involving
honest vs. deceptive responses is this difference in response selection.
It
is noted (Figure 6) that in the Lie group, the scaled OD2-LIE (dishonest
response) curve is downshifted at Cz and Fz and upshifted at Pz relative to
both the honest condition of Block 1 (OD1[L]) as well as to the honest response
trials of Block 2 (OD2-TRU). It is
also downshifted in comparison with all Control group curves at Fz and Cz, and
upshifted at Pz. (We do not here
intend to interpret the interactions on scaled data in terms of loci of
cortical activity responsible for the interactions, as noted in the Results
section, but only mean to describe unique features of the interaction in the
Lie group.) These interactions
strongly suggest that the lie response has a unique effect on brain
operation. The fact that unscaled
amplitudes are uniquely reduced in the Lie group during dishonest responses
also supports a unique attribute related specifically with dishonest responses.
A
question may be raised here regarding ecological validity. Our Lie subjects
were not, in fact, lying in the way people do in the field. In our instructions
to them, however, we repeatedly reminded them that when they would respond as
if they were making errors, that in fact, they would know very well that these were not genuine
errors, but lies. (One subject actually refused to complete the study at this
point and was released.) Nevertheless, it remains a limitation here that the
subjects were executing directed rather than voluntary lies.
It
was essential, in the design of this study, that there be no differences among
the P300s associated with both blocks and groups during the honest
responses. This requirement was
mandated by our plan to pool honest, forwards responses so as to generate
benchmark/baselines as described above.
However, we also had application issues in mind: In any anticipated uses
of these methods with real suspects in the field, it may be essential to have
data from a control/baseline session, in which the suspect is known to be
responding truthfully, with which to compare, in the same subject, data
obtained during a test session in which the subject’s (dis)honesty is to be
ascertained. The present results
in the Lie group which showed no differences between P300 distributions
associated with truthful responses from both the first and second blocks, but
differences between pooled truthful responses and dishonest responses, suggest
that it should be possible to develop procedures, based on current group
results, for future intraindividual diagnosis.
There
is another implication regarding the data obtained from both groups during
honest, forwards responding: One might have predicted differences between data
sets obtained from the two blocks during honest, forwards responding on the
basis of the fact that the first block utilized phone numbers as stimuli,
whereas the second block utilized (birth) dates. A participant might have been expected to show different
scaled amplitude profiles to these two kinds of stimuli on the basis of
different cognitive processing of the two classes. Such differences were not observed. (Of course, such differences might be
seen in data from other scalp sites.)
This negative outcome suggests that the specific nature of the stimulus
does not play a significant role in determination of profile shape in the
present context: Rather, an autobiographal oddball stimulus yields a typical Pz
> Cz > Fz profile which does not differ as a function of the specific
nature of the stimulus, so long as an honest response occurs to the
stimulus. Dishonest responses,
however, affect the profile. We
could have counterbalanced across participants the order of stimulus class used
in the present study in order to control (unobtained) effects of differing
stimulus classes. We chose not to
counterbalance because while this counterbalanced design would have been easily
implemented in the present laboratory analog, it would appear to present major
problems in intraindividual field tests.
References
Allen,
J., Iacono, W.G. and Danielson, K.D. (1992). The identification of concealed
memories using the event-related potential and implicit behavioral measures: A
methodology for prediction in the face of individual differences. Psychophysiology, 29, 504-522.
Donchin,
E., Kramer, A., & Wickens, C. 1986).
Applications of brain event-related potentials to problems in
engineering psychology. In M. Coles,
S. Porges and E. Donchin (Eds.), Psychophysiology: systems, processes and
applications. New York: Guilford.
Donchin,
E., Spencer, K., & Dien (1997).
The varieties of deviant experience: ERP manifestation of deviance
processors in Van Boxtel, G.J.M. & Bocken, K.B.E. (Eds.), Brain and
Behavior: Past, Present, and Future, Tilburg University Press, p. 116.
Fabiani,
M., Gratton, G., Karis, D., & Donchin, E (1987). The definition, identification, and reliability of
measurement of the P3 component of the event-related potential. In P.K. Ackles, J.R.
Jennings, & M.G.H. Coles (Eds.), Advances in psychophysiology Vol. 2, Greenwich:
JAI Press.
Ellwanger,
J., Rosenfeld, J.P.,
Sweet, J.J. & Bhatt, M. (1996).
Detecting simulated amnesia for autobiographical and recently learned
information using the P300 event-related potential. International Journal of Psychophysiology, 23, 9-23.
Farwell,
L.A., & Donchin, E. (1991).
The truth will out: Interrogative polygraphy (“lie detection”) with
event-related potentials. Psychophysiology,
28,
531-547.
Johnson,
R., Jr. (1988). The amplitude of
the P300 component of the event-related potential. in P.K. Ackles, J.R. Jennings, & M.G.H. Coles (Eds.), Advances
in psychophysiology
Vol. 2 (pp. 69-138). Greenwich,
Ct: JAI Press.
Johnson,
R. (1993). On the neural
generators of the P300 component of the event-related potential. Psychophysiology, 30, 90-97.
Kramer,
A.F., Sirevaag, E.J., & Braune, R. (1987). A psychological assessmentof operator workload during
simulated flight missions. Human
Factors, 29(2), 145-160.
Lykken,
D.T. (1981). A tremor in the
blood. New York: McGraw-Hill.
McCarthy,
G. & Wood, C. (1985). Scalp
distributions of event-related potentials: an ambiguity associated with
analysis of variance models. Electroenceph.
Clin. Neurophysiol., 62, 203-208.
Rosenfeld,
J.P.,
Angell, A., Johnson, M., & Qian, J. (1991). An ERP-based, control-question lie detector analog:
Algorithms for discriminating effects within individuals’ average waveforms. Psychophysiology, 38, 319-335.
Rosenfeld,
J.P.,
Cantwell, G., Nasman, V.T., Wojdac, V., Ivanov, S., & Mazzeri, L.
(1988). A modified, event-related
potential-based guilty knowledge test.
International Journal of Neuroscience, 24, 157-161.
Rosenfeld,
J.P.,
Reinhart, A.M., Bhatt, M., Ellwanger, J., Gora, K., Sekera, M., & Sweet, J.
(1998). P300 Correlates of
simulated amnesia on a matching-to-sample task: Topographic analyses of
deception vs. truth-telling responses.
International Journal of
Psychophysiology, 28,
233-248.
Rosenfeld,
J.P.
& Ellwanger, J.W. (1999).
Cognitive Psycholphysiology in Detection of Malingered cognitive
deficit. Forensic
Neuropsychology: Fundamentals and Practice, J.J. Sweet (Ed.), Lisse, Netherlands:
Swets & Zeitlinger.
Rosenfeld,
J.P.,
Ellwanger, J.W., Nolan, K., Wu, S., Bermann, & Sweet, J.J. (1999). P300 scalp amplitude distribution as an
index of deception in a simulated cognitive deficit model. Int. J. Psychophysiol., 33(1), 3-20.
Ruchkin,
D.S., Johnson, R., Grafman, J., Canoune, H., & Ritter, W. (1992). Distinctions and similarities among
working memory processes: an event-related potential study. Cognitive Brain Research, 1, 53-66.
Ruchkin,
D.S., Johnson, R., & Friedman, D. (1999). Scaling is necessary when making comparisons between shapes
of event-related potential topography.
Psychophysiology, 36, 832-834.
Article
submitted for publication: 14 January 2002
Revision
submitted: 22 May 2002
Article
accepted for publication: 8 June 2002